Information Design · Data Visualization · Civic
Municipal Budget Dashboard
Where the City's Money Goes, Made Clear
- Role
- Creative Director · Information Designer
- Year
- 2025
- Categories
- Civic · Enterprise · Innovation
- Tools
- Next.js · TypeScript · Data Visualization · Editorial Design
Live Interactive Preview
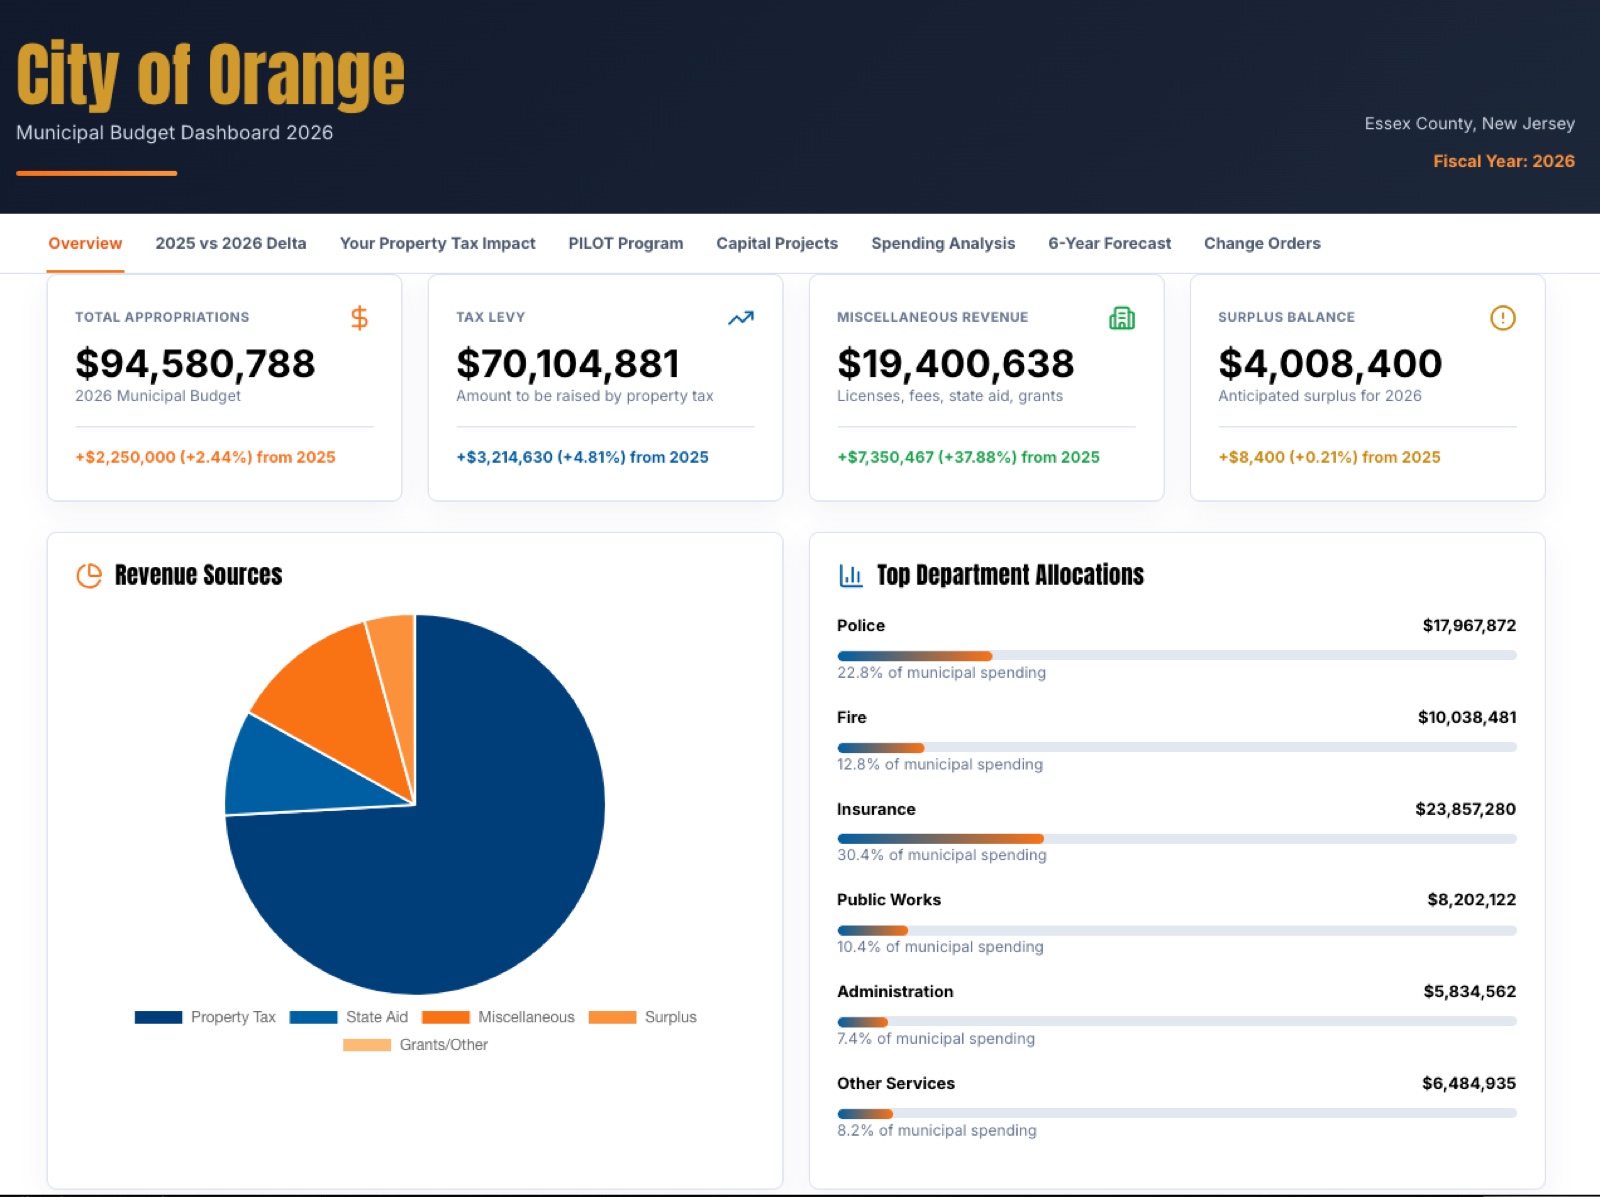
The live public dashboard — a real $94.6M municipal budget, broken down.
 Open Live Dashboard
Overview
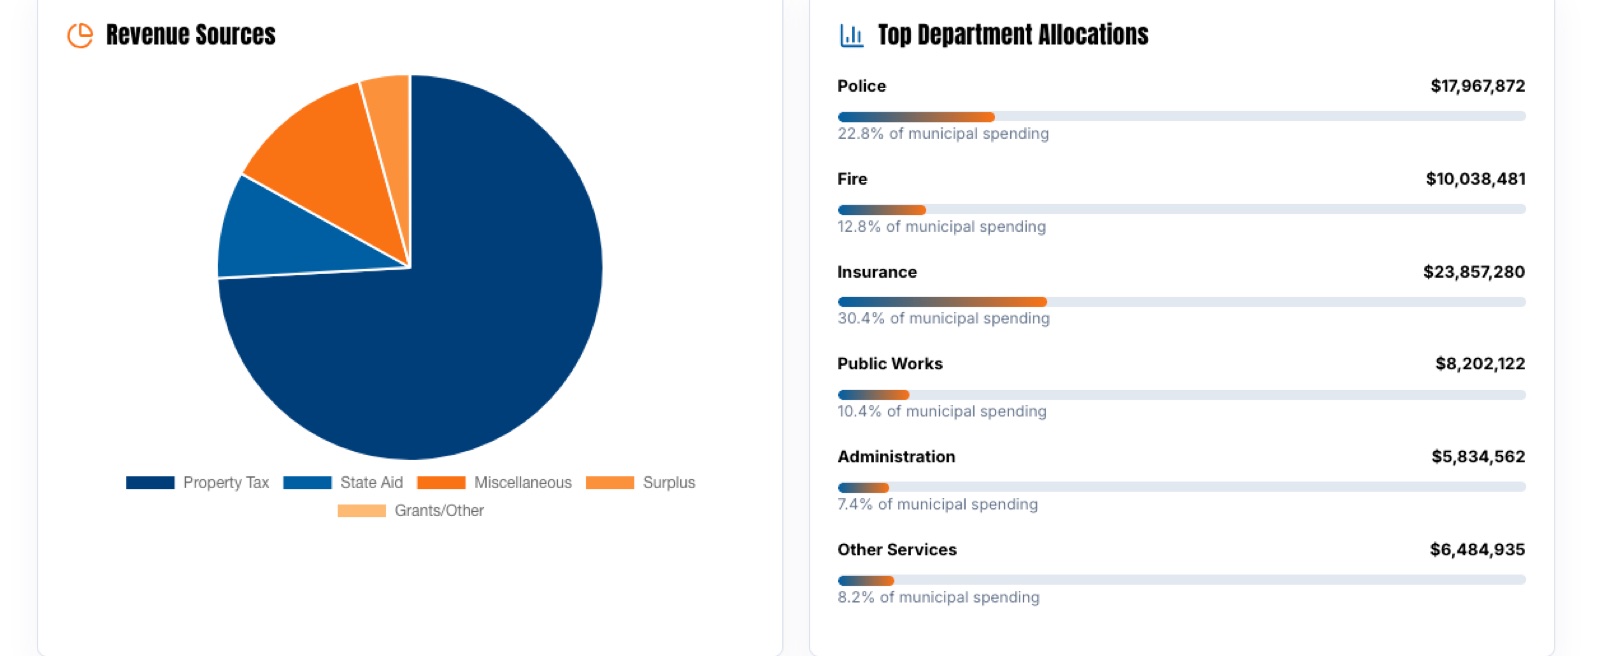
A public budget dashboard for the City of Orange that turns a $94.6M municipal budget into something a resident can read in a minute — appropriations, tax levy, revenue sources, department allocations, and year-over-year change.
The Challenge
A municipal budget is public but opaque — hundreds of line items no one outside the finance office reads. The work made the whole budget legible and comparable at a glance.
Creative Direction
Direction led with the numbers that matter — total appropriations, tax levy, surplus — then let residents drill into revenue sources, department spend, capital projects, and a six-year forecast. Plain language over line items.