Data Visualization · Civic Transparency · Looker Studio
Zoning Board Public Reporting
Making a City's Land-Use Decisions Legible
- Role
- Board Chair · Dashboard Design · Data Visualization
- Year
- 2024–2026
- Categories
- Civic · Innovation · Enterprise
- Tools
- Looker Studio · Google Sheets · Google Maps · Data Modeling
Live Interactive Preview
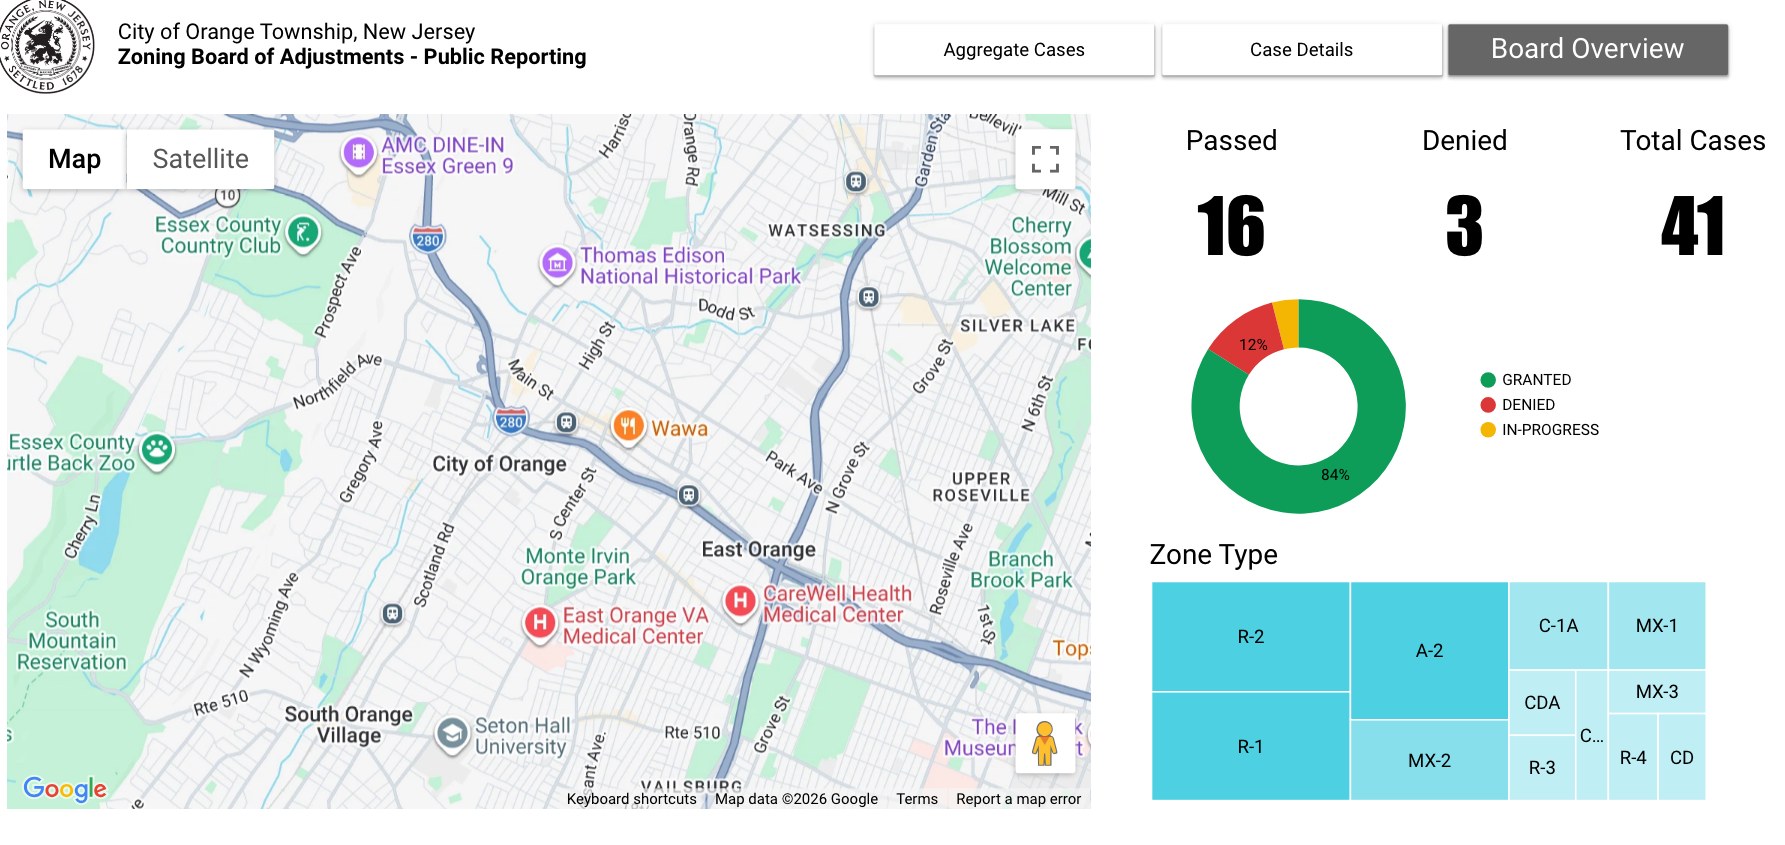
The live public dashboard — pop it out and explore real Zoning Board case data.
Overview
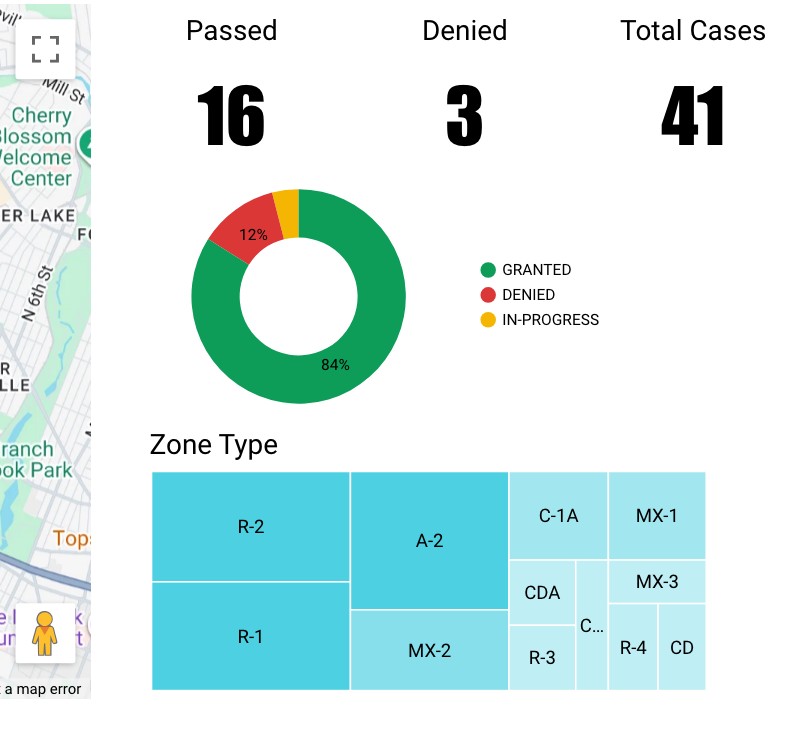
A public reporting dashboard for the City of Orange Zoning Board of Adjustment, built in Google Looker Studio during James's tenure as Board Chair. It turns the board's docket into an at-a-glance view of applications, outcomes, and geography — open to any resident or applicant.
The Challenge
Zoning decisions shape a city, but the record lives in meeting minutes and PDFs. The work was to make the board's activity transparent and legible to the public, from a single maintained data source, without adding staff burden.
Creative Direction
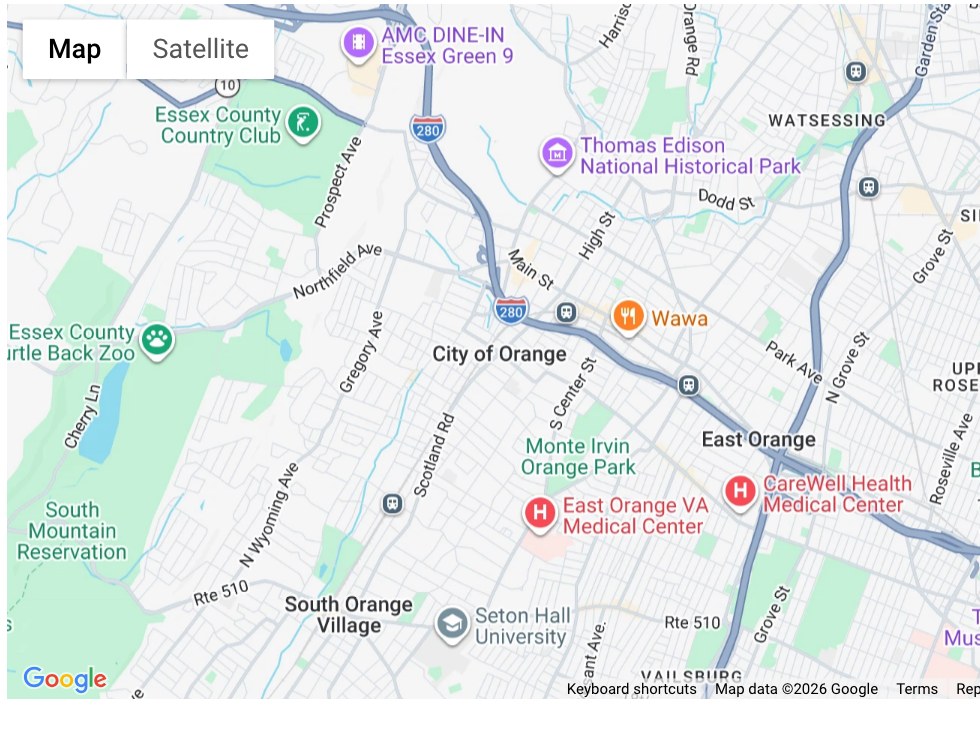
Designed as civic infrastructure rather than a report: a clean, trustworthy layout that leads with outcomes, maps every case to its address, and breaks activity down by zoning district — one source of truth, published publicly and updated as the docket moves.